[Digest summary] Methane and carbon dioxide can be converted into CO₂-equivalent emissions through Global Warming Potential (GWP), but this is not a fixed exchange rate that exists in nature. It is a comparison method built for a chosen time horizon and a chosen policy purpose. In September 2026, an ETH Zurich team published a study in Communications Earth & Environment that decouples the CO₂ and methane mitigation pathways. The core message compresses into a single sentence: methane mitigation cannot substitute for net-zero CO₂, but without deep methane cuts, even reaching net-zero CO₂ by mid-century may not be enough to hold warming “well below” 2°C.
1. CO₂e is a comparison tool, not a fixed exchange rate
The research team uses an analogy to make the point. Asking how much methane equals a tonne of CO₂ is about as tractable as asking how much spaghetti equals a chicken. You could compare them by calories, by protein, or by price. Each comparison is convenient, and each is valid only for the question you asked — no quantity of spaghetti is actually a chicken.
GWP compares the cumulative radiative forcing caused by a greenhouse gas over a specified period, relative to the same mass of CO₂. Corporate inventories and most national inventories use GWP100, which looks at the cumulative effect over the 100 years following emission. Under IPCC AR6:
| Gas | GWP100 (AR6) |
|---|---|
| CO₂ | 1 |
| Non-fossil methane | 27.0 |
| Fossil methane | 29.8 |
| Nitrous oxide (N₂O) | 273 |
Fossil methane carries the higher value because the CO₂ formed when it oxidises in the atmosphere is itself fossil carbon, and continues to cause long-term warming.
But these are not physical constants. Choose a 20-, 100- or 500-year horizon and the conversion factor changes. GWP100 answers the question: over the 100 years after emission, how many tonnes of CO₂ would cause the same cumulative radiative forcing as this tonne of gas? It does not directly answer: how much will this emission raise global temperature in a particular year? The two questions look adjacent. They are not the same.
2. CO₂ and methane warm the planet by different logics
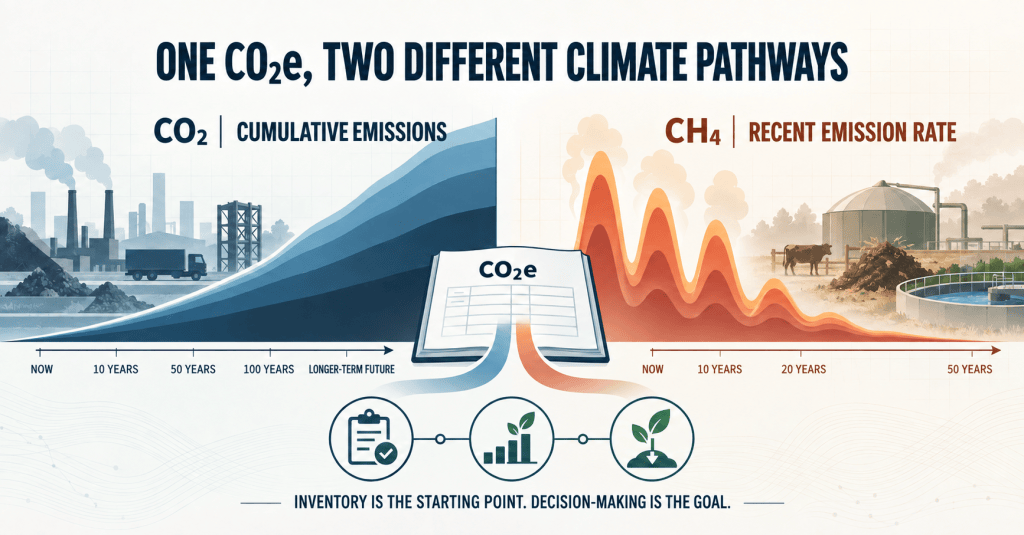
CO₂ is a long-lived greenhouse gas. The warming it causes is roughly proportional to cumulative historical emissions. As long as net CO₂ emissions continue, the cumulative total rises and so does temperature. Managing CO₂ therefore means controlling cumulative emissions, cutting annual emissions quickly, reaching global net zero, and not mistaking temporary reductions for permanent solutions.
Methane is a short-lived but highly potent climate pollutant. The study uses a mean atmospheric lifetime of about nine years. Individual methane molecules are removed over time, but continued annual emissions keep replenishing the atmospheric concentration. Anthropogenic methane already contributes more than 0.6°C to global warming.
Methane-driven warming therefore depends far more on the recent emission rate. If emissions keep rising, methane-driven warming rises quickly. If they hold roughly flat, additional warming levels off. If they fall steadily, near-term warming pressure eases and a modest interim cooling effect becomes possible.
This is why a single GWP100 figure cannot fully represent two gases with such different temporal responses.
3. What GWP20, GWP100 and GWP* each answer
GWP20: foregrounds the near-term crisis
By looking at cumulative impact over 20 years, GWP20 gives methane greater weight. It suits assessments of near-term warming, tipping-point risk and short-term public health impacts. But it can also understate effects beyond 20 years, which amounts to implicitly discounting future climate damage within the metric’s design.
GWP100: a common accounting language
GWP100 lets countries, companies and products aggregate multiple greenhouse gases into consistent units. It is the primary method under the UNFCCC, the GHG Protocol and most corporate inventories. Its strengths are standardisation, comparability and verifiability. Its weakness is that it obscures the entirely different temporal responses of short- and long-lived gases.
GWP*: closer to the rate-temperature relationship
Rather than comparing a single year’s emissions, GWP* tracks the change in the methane emission rate, and so better represents how rising, flat or falling methane affects global temperature.
It is also contested, and the controversy turns on how low the threshold sits: under GWP*, cutting methane emissions by roughly 0.33% per year registers as causing “no additional warming,” with the remaining emissions counted as zero CO₂-warming-equivalent. That framing quietly assumes the continuation of historical warming levels. If a sector with a long history of high methane emissions makes only modest cuts and is then described as causing no additional warming, the warming it has already caused — and continues to sustain — drops out of view.
GWP* works well as a supplementary temperature-analysis tool, but should not replace judgements about emission responsibility and equity. The study notes that adopting the GWP* view leaves a best-estimate 2°C remaining carbon budget of only about 750 GtCO₂ (5th–95th percentile: 290–1,230), with the 1.7°C budget nearly depleted.
4. What the 2026 study found
Rather than first choosing a conversion factor between methane and CO₂, the team inverted the question: if peak global warming is to be held to a given level, and the net-zero CO₂ year is already set, what is the minimum methane reduction compatible with that?
Methodologically, the study uses the AR6-calibrated simple climate model FaIR (v2.1.3, calibration v1.4.1), systematically combining linear CO₂ reduction pathways starting in 2024 with a range of methane trajectories, then computing peak warming to 2100. The minimum methane reduction thresholds relative to 2020, at 50% likelihood, are:
| Peak warming | Net-zero CO₂ 2050 | 2060 | 2100 | Net-zero GHG 2050 | 2060 | 2100 |
|---|---|---|---|---|---|---|
| 1.7°C | −69% | — | — | −63% | — | — |
| 1.8°C | −32% | −56% | — | −11% | −47% | — |
| 2.0°C | +8% | −8% | −83% | >+50% | +33% | −78% |
A dash means no methane trajectory is compatible with that peak warming for that net-zero year. The positive values in the bottom row should not be read as licence for methane to keep rising. They mark the model boundary that just avoids exceeding 2°C under the study’s linear pathways, its assumptions about other gases, and a 50% likelihood. If the policy goal is “well below” 2°C, or a higher probability of success, or lower extreme-weather risk, the required methane cuts become substantially stricter.
Other key findings:
- Regardless of how stringent methane mitigation is, limiting warming to 1.5°C is no longer plausible.
- Without methane mitigation, peak warming exceeds 1.7°C for every net-zero CO₂ target year; where net-zero CO₂ arrives in 2040 or later, it exceeds 1.85°C.
- Even with net-zero CO₂ in 2050, an absence of methane mitigation brings peak warming to almost 2°C.
- Under current policies, methane is expected to rise around 20% by 2050 relative to 2020. On that path, peak warming exceeds 2°C even if global CO₂ reaches net zero on schedule.
- Conversely, slow decarbonisation can still hold 2°C — but only paired with very strong methane cuts: net-zero CO₂ in 2100 combined with an 83% linear methane reduction limits peak warming to 2°C.
- Fully exploiting the near-term mitigation potential available with current measures (~32–34% by 2030) prevents about 0.15°C of peak warming this century, of which roughly 0.05°C comes from measures at no net cost.
5. The remaining carbon budget: how methane moves the denominator
This is the section with the most operational significance for companies and policymakers.
For 2°C — and generally for warming above 1.9°C — the remaining carbon budget is nearly linearly dependent on the mid-century methane target. The study quantifies the trade-off: failing to reduce 2050 methane emissions by 10% relative to 2020 (about 35 MtCH₄/year) reduces the 2°C remaining carbon budget by roughly 165 GtCO₂ (5th–95th percentile: 128–225 GtCO₂), equivalent to about four years of current global CO₂ emissions.
The study also explains why commonly cited 2°C budgets (around 1,015–1,150 GtCO₂ as of 2025) are higher: those estimates already embed assumed methane reductions simulated by integrated assessment models. If methane does not fall as implicitly assumed, the usable budget is far smaller. With no methane reductions at all, less than 600 GtCO₂ remains for 2°C — under 15 years at current emission levels.
And under the same conditions, the remaining carbon budget for 1.7°C was already depleted before 2025.
Methane mitigation, in other words, is not a matter of adjusting inventory figures. It directly changes the global remaining carbon budget and the temperature peak. The authors also caution that because total anthropogenic methane emissions are finite, there is a physical limit to how far methane cuts can expand the budget.
6. Methane mitigation cannot substitute for net-zero CO₂
The easiest way to misread this study is to treat methane mitigation as room to delay CO₂ reductions.
Rapid methane cuts genuinely do slow warming over the next two to three decades, reduce the risk of crossing tipping points, cut ozone pollution and its health damages, and buy time for energy and industrial transition. But they cannot remove historical cumulative CO₂, cannot stop the long-term warming CO₂ continues to cause, and cannot address ocean acidification.
The authors are explicit on this point: the benefit of methane mitigation for peak warming is only realised if net-zero CO₂ is actually achieved. Net-zero CO₂ and methane reduction are not alternatives. They are two tasks that must be completed together.
7. What this means for companies: three ledgers
None of this means companies should stop using CO₂e. The GHG Protocol still requires the IPCC’s 100-year GWP for formal inventories, along with disclosure of which IPCC version was applied. What companies need is a layer of temperature management on top of compliance accounting.
Ledger one: compliance
- Use GWP100 under the GHG Protocol, ISO 14064 and applicable disclosure requirements.
- Keep base-year and reporting-year methodology consistent.
- Disclose whether AR4, AR5 or AR6 coefficients are used.
- Distinguish fossil from non-fossil methane.
- For Scope 1, disclose physical emissions by gas alongside CO₂e.
Ledger two: reduction
- Set CO₂ and methane as two independent reduction pathways.
- Govern CO₂ by cumulative emissions and a net-zero year.
- Govern methane by absolute emissions, emission rate, and 2030/2050 reduction milestones.
- For methane-material companies, add GWP20 or GWP* scenario analysis as a supplement.
- Do not allow methane reductions to offset a delayed net-zero CO₂ commitment.
Ledger three: removals
- Disclose quantities, methods, boundaries and durability separately.
- Match them explicitly to the residual emissions they address.
- Do not blend removals into reduction figures, diluting source reduction that has not yet happened.
For methane-intensive sectors — agriculture, livestock, food, oil and gas, coal, waste, landfill and wastewater treatment — publishing a single aggregate CO₂e figure is no longer sufficient to support real climate decisions.
8. Three industries, three entry points
Global manufacturing and supply chains
A product carbon footprint should not end at the total. CO₂ from electricity, materials, processes and logistics must remain distinguishable from methane potentially associated with wastewater, organic waste, landfill treatment and agricultural inputs. Preserving gas- and source-level data is what allows a company to choose between clean energy, material substitution, process efficiency and methane-source control — and to pass precise requirements through Tier 1, Tier 2 and upstream suppliers.
Construction and the built environment
Long-lived CO₂ from steel, cement, materials and construction energy should not be treated as interchangeable with methane risk from gas systems, wastewater, organic waste and end-of-life disposal simply because an inventory converts both into CO₂e. Low-carbon materials, electrification, waste separation and methane recovery solve different problems and require different investment sequencing.
Environmental data and software services
The next generation of carbon-management systems must do more than produce a polished CO₂e total. Data models should preserve the gas, source, year, fossil or biogenic origin, GWP version, and the distinction between reductions and removals. Dashboards should display the cumulative CO₂ pathway, the methane emission rate, and the quality and durability of removals side by side.
9. The SSBTi view: from one ledger to two curves
Climate governance should not abandon CO₂e — the world still needs a common, comparable inventory language. But CO₂e should return to the position it suits best: an accounting and aggregation tool, rather than the single answer to every climate question.
A more mature net-zero architecture answers four questions at once:
- Which greenhouse gas is being emitted?
- How long does it stay in the atmosphere?
- Is the emission rate rising, flat or falling?
- When, and at what temperature, does this pathway peak?
Corporate and national climate targets should therefore evolve from a single aggregate CO₂e reduction rate into at least two distinct curves: a CO₂ curve falling continuously to net zero, and a methane curve falling rapidly, continuously and deeply in the near term.
Inventory is the starting point, not the destination. The real question is not whether methane and CO₂ can be converted into one another, but this: have we mistaken a conversion tool built for convenience of comparison for the climate system itself?
Limitations
The study analyses global scenarios rather than allocating equitable reduction responsibility to individual countries or companies. Its figures rest on several important premises: CO₂ and methane follow linear reduction pathways (integrated assessment models typically produce non-linear trajectories); the headline results assume a 50% likelihood of staying below the stated peak, and raising that to 67% demands substantially stricter methane cuts; emissions of other climate forcers are inferred through an infilling model; and results are affected by climate sensitivity uncertainty — the study notes that overall peak-warming uncertainty is dominated by the climate system response (~0.5°C), with remaining scenario uncertainty around 0.1°C.
Figures such as 69%, 63% or 32% should therefore be read as model results under specific global scenarios, not as statutory targets transferable to any individual company. But the direction the study reveals is unambiguous: setting a net-zero CO₂ year without an independent and stringent methane target does not constitute a credible global temperature strategy.
Sources
- Weber, K., Knutti, R., Brun, L. & Brunner, C. (2026). Limiting warming by CO₂ and methane mitigation in an expanded scenario space. Communications Earth & Environment 7:654.
- Carbon Brief (1 September 2026). Guest post: Why tough methane cuts are crucial for keeping warming ‘well-below’ 2C.
- IPCC AR6 WGI, GWP100 values.
- UNEP, Global Methane Status Report 2025.
- IEA, Global Methane Tracker 2025.
This Digest is a methodological analysis. It does not constitute a determination of conformity with any particular standard, and does not replace the verification procedures required under ISO 14064/14067.
 The Real Footprint Digest
發表留言