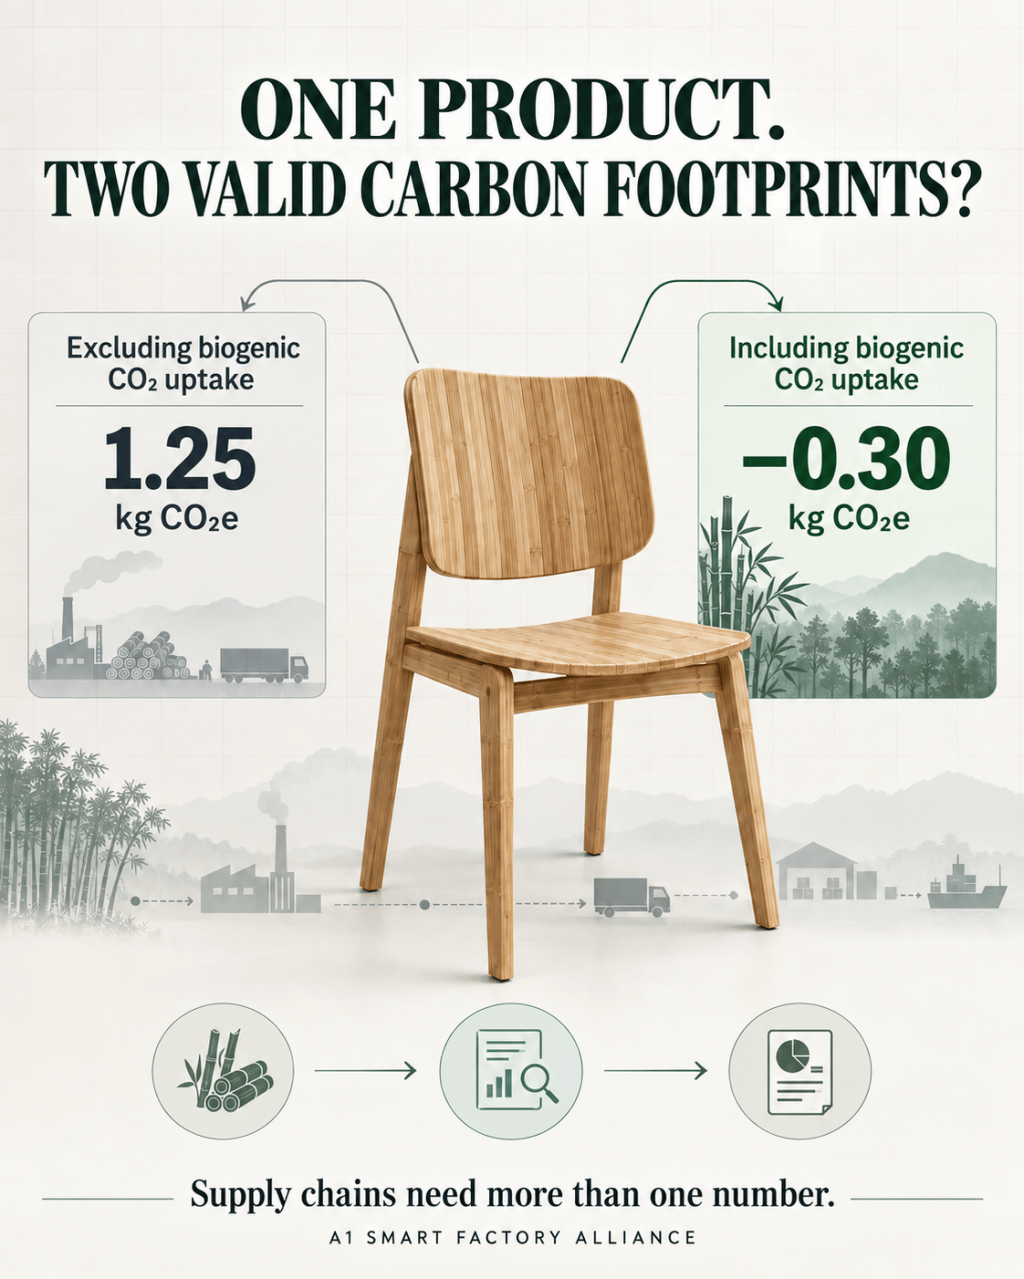
[Digest summary] A bio-based product can legitimately report a carbon footprint of 1.25 kg CO₂e and −0.30 kg CO₂e at the same time. Both are complete product carbon footprint (PCF) totals; they differ only in whether the biogenic CO₂ taken up by the product is counted. PACT Methodology 3.0 requires both. The practical lesson for suppliers is that customers are no longer asking for one number: PCF templates now carry a dozen or more fields, and each LCA software result has to be mapped to the right one. The divergence enters at three levels — inventory, method and reporting — and a negative including-uptake result should never be read on its own as a carbon-negative product.
Adapted from a professional article by our partner CPCD/SSBTi. Author: Zhou Quan · Editor: Zhong He · Commentary: Lao C.
1. Why PCF exchange stopped being about a single number
Over the past two to three years, supply-chain PCF exchange has accelerated sharply. The Partnership for Carbon Transparency (PACT), led by WBCSD, is being rolled out globally; Together for Sustainability (TfS) has put PCF exchange into practice across the chemicals chain; and the EU Battery Regulation and the Carbon Border Adjustment Mechanism (CBAM) have turned product carbon footprints from a bonus point into a condition of market access. Brands and lead firms now routinely send suppliers PCF data templates.
Suppliers who open those templates quickly find they are not being asked for a total. A single template may request two PCF totals, fossil emissions, biogenic emissions, land use change, product carbon content and more — each with its own definition, sign convention and reporting obligation. For products containing bio-based material or involving land use, the fields become particularly demanding.
The software side does not simplify matters. Under ecoinvent’s IPCC method, GWP100 alone carries subcategories for total, fossil, biogenic and land use change, plus variants that include or exclude biogenic CO₂ and long-term emissions. Which result belongs in which field? What does a negative value mean? Do the subcategories add up to the total? Get these wrong and the data either fails to reconcile or cannot be used downstream.
2. The example: 1.25 or −0.30
PACT 3.0 asks companies to calculate and exchange two cradle-to-gate results: a PCF excluding biogenic CO₂ uptake and a PCF including it. The labels differ by one word; the values can differ a great deal.
Take 1 kg of a bio-based material with a PCF of 1.25 kg CO₂e excluding uptake. The product contains about 0.423 kg of biogenic carbon. Converting carbon to CO₂ by molecular weight (× 44/12) gives an uptake of about 1.55 kg CO₂. Include that uptake and the PCF becomes −0.30 kg CO₂e.
| Method | Contribution of product uptake | PCF total |
|---|---|---|
| 0/0, excluding uptake | 0 | 1.25 kg CO₂e |
| −1/+1, including uptake | −1.55 | −0.30 kg CO₂e |
Three distinct numbers now exist, and current standards and guidance generally expect all three to be reported: −0.30 (the complete PCF under the including-uptake convention), 1.55 (the product’s biogenic CO₂ uptake, reported separately) and 0.423 kg C (the product’s biogenic carbon content).
−0.30 does not mean the product has achieved a permanent removal. If the system boundary extends to end of life and the 1.55 kg CO₂ is eventually released entirely as biogenic CO₂, the −1 and +1 cancel out. If part of the carbon is released as methane instead, the methane factor applies and the result no longer nets to zero.
3. How a PCF is actually calculated
Life cycle impact assessment (LCIA) reduces to a simple relationship: the climate change result equals the sum of each elementary flow multiplied by its characterisation factor (CF).
An elementary flow is an exchange between the product system and the natural environment — an emission to air, water or soil, or a resource taken from nature, such as 1 kg of fossil CO₂ emitted to air or 1 kg of CO₂ absorbed from air by growing biomass. The characterisation factor converts each flow onto a common scale, usually kg CO₂e per kg of gas.
Electricity, materials and transport services entered by a modeller are not elementary flows; they are technosphere (product) flows. To reach the elementary flows behind them, the model starts from the final demand of the functional unit and resolves every upstream process the supply chain requires. In matrix form:
h = C × g = C × B × A⁻¹ × f
- A is the technology matrix of inputs and outputs between processes; f is the final demand (for example, 1 kg of product). Solving
A × s = fgivess = A⁻¹ × f, the activity level each upstream process must run at. A⁻¹ plays the same role as the Leontief inverse in input–output models. - B is the elementary flow matrix.
g = B × sis the life cycle inventory (LCI): total fossil CO₂, fossil CH₄, biogenic CO₂ taken up, and so on, still recorded gas by gas. - C is the characterisation matrix.
h = C × gis the LCIA result; if C holds only GWP100 factors, h is the PCF.
Following that chain shows exactly where two PCFs can diverge:
- Inventory level — whether an emission, uptake or change in land carbon stock is modelled and recorded at all.
- Method level — which characterisation factor each elementary flow is matched to.
- Reporting level — which subcategories sit inside the total and which must be reported separately.
4. Inventory level: how biogenic carbon is recorded
The inventory question is concrete: which elementary flow represents the biogenic carbon in the product? It matters because the same carbon flow, recorded as a different elementary flow, receives a completely different factor in the LCIA method.
ecoinvent 3.12 implements two complementary IPCC 2021 methods:
- IPCC 2021 (0/0) — biogenic CO₂ uptake and release both carry a factor of 0. Plant uptake is assumed to return to the atmosphere eventually, so the two cancel and never appear in the result. The EU Environmental Footprint (EF) method takes the same neutral approach.
- IPCC 2021 incl. biogenic CO₂ (−1/+1) — uptake carries −1 and release +1, so both are booked explicitly and the carbon currently stored in the product becomes visible. This matches ISO 14067’s treatment of biogenic emissions and removals.
These correspond in logic to PACT’s two totals: the excluding-uptake PCF applies neutral 0/0 treatment to product uptake; the including-uptake PCF books it as a negative under −1/+1. Both still have to account for biogenic non-CO₂ gases, land use change and all other emissions. PACT requires both because each alone misleads: a lone negative number invites the misreading that the product delivers a permanent removal and can hide carbon imbalances across the boundary, while 0/0 alone can obscure the genuine mitigation potential of some bio-based products.
GWP100 factors for common ecoinvent 3.12 elementary flows:
| ecoinvent elementary flow | Compartment | 0/0 method | −1/+1 method |
|---|---|---|---|
| Carbon dioxide, fossil | air | 1 | 1 |
| Carbon dioxide, non-fossil | air | 0 | 1 |
| Carbon dioxide, in air | natural resource | 0 | −1 |
| Carbon dioxide, from soil or biomass stock | air | 1 | 1 |
| Carbon dioxide, to soil or biomass stock | soil | −1 | −1 |
| Methane, fossil | air | 29.8 | 29.8 |
| Methane, non-fossil | air | 27 | 29.8 |
| Methane, from soil or biomass stock | air | 29.8 | 29.8 |
Carbon dioxide, in air represents uptake by growing biomass; Carbon dioxide, non-fossil represents biogenic CO₂ returning to the atmosphere.
Soil and biomass carbon stocks are handled separately. ecoinvent treats these stocks as having formed before the LCA’s time frame, so human-caused losses add carbon to the atmosphere: flows from soil or biomass stock take the same factor as the equivalent fossil flow, while net stock gains are recorded via to soil or biomass stock at −1. These flows typically appear in land use and land management processes and are kept apart from short-cycle non-fossil CO₂. Land use change modelling may also involve CH₄ and N₂O assigned to these compartments.
The examples here use ecoinvent. EF, ILCD and other data formats design their elementary flow names, identifiers and compartments differently, so mappings must be rechecked when switching database. Only when flows are recorded completely and matched accurately can the PCF be both calculated and explained.
5. Method level: where the characterisation factors come from
The IPCC defines climate metrics and their values; LCIA methods then map those metrics onto their own elementary flow systems. GWP compares the cumulative radiative forcing from a pulse emission over a chosen horizon; GTP compares the temperature response at a single future point. They answer different questions. ISO 14067:2018, PACT 3.0 and the GHG Protocol all use GWP100 as the primary PCF metric.
On versions: ISO 14067 expects the latest IPCC values to be used once published, unless otherwise specified and justified. PACT allows old and new IPCC versions in parallel during the year a new assessment report is published and the year after; beyond that, new or updated PCFs should use the latest version.
Methane shows how much the method level matters. ecoinvent 3.12 translates IPCC 2021 methane GWP100 as follows:
| Elementary flow | GWP100 | Typical sources |
|---|---|---|
| Methane, fossil | 29.8 | Natural gas leakage, coal mine fugitive emissions |
| Methane, non-fossil | 27 (0/0) | Ruminants, rice paddies, biomass decomposition |
| Methane, unspecific | 27.9 | Source cannot be distinguished; use only when source information is missing |
A common error: methane from fossil fuel combustion
Fossil methane carries the higher factor because, once oxidised, it adds fossil CO₂ to the atmosphere. Fossil fuel combustion is the exception. Emission inventories already calculate CO₂ on the assumption that 100% of the fuel’s carbon oxidises to CO₂. Assigning 29.8 to the CH₄ from combustion would count the CO₂ effect of methane oxidation a second time. Methane from fossil fuel combustion should therefore use GWP100 = 27, not 29.8. The 27 here reflects a convention that excludes the oxidation contribution; it has nothing to do with whether the methane is biogenic.
Biogenic methane follows the method in use: under 0/0, Methane, non-fossil takes 27; under −1/+1, where biogenic CO₂ uptake and release are booked explicitly, the same flow takes 29.8.
The source article also notes that a sustainability-reporting guideline issued by mainland China’s three stock exchanges gives the AR6 methane GWP100 as 28 — reportedly a rounding of the unspecified-source value of 27.9 to reduce computation and stay close to AR5. The author’s view, which we share, is that any such convention should be stated explicitly in the guidance to avoid ambiguity in data handling.
Categories such as SLCFs, long-term emissions, fossil, direct land use change and incl. biogenic CO₂ are not methodologies prescribed by the IPCC. Their classification, flow matching and naming are designed by LCIA method developers such as ecoinvent. The IPCC supplies the climate science; it does not define the results a software package displays, nor the fields a supply chain exchanges.
6. Reporting level: how software results are organised
The ecoinvent LCI database answers how much was emitted and taken up; the bundled IPCC 2021 LCIA methods answer how much climate impact that represents. Even with the same background database, the software produces many results. Where a supply-chain disclosure rule specifies the LCIA method, version, indicator, horizon or biogenic convention — including an older method such as IPCC 2013 (AR5) required by an EPD programme, PCR or customer — that rule applies, and the version should be stated on delivery.
| Dimension | Main categories or indicators | Purpose |
|---|---|---|
| Source of impact | total, fossil, direct land use change, biogenic | Total result and its source breakdown |
| Emissions vs removals | dLUC emissions, dLUC removals; biogenic emissions and removals in the incl. biogenic method | Preserve the direction of carbon flows |
| Time and climate metric | GWP20, GWP100, GWP500, GTP50, GTP100 | Different horizons or temperature response |
| Method boundary | excl. biogenic CO₂, incl. biogenic CO₂, incl. SLCFs, no LT | Whether biogenic CO₂, SLCFs and long-term emissions are included |
- GWP100 has the fullest set of subcategories. In ecoinvent 3.12, GWP20, GWP500, GTP50 and GTP100 are provided only as totals and are best used for supplementary analysis.
- Short-lived climate forcers (SLCFs) are substances with atmospheric lifetimes under roughly 20 years that affect climate directly or indirectly. ecoinvent positions these categories as sensitivity-analysis tools. ISO 14067’s carbon footprint of products (CFP) is limited to greenhouse gases and does not include black carbon or aerosols.
- Long-term emissions (LT), in ecoinvent’s definition, are released more than 100 years after the process begins. Including them may overstate impacts; excluding them may understate. Most current standards and guidance favour the no LT version, but the choice should be justified against the applicable standard, PCR and study boundary, with both results compared during interpretation.
7. What ISO 14067 and PACT 3.0 each ask for
ISO 14067:2018 sets out quantification principles and CFP study report content. PACT 3.0 governs cradle-to-gate PCF exchange and specifies which fields must be passed along. Both use GWP100 and both address biogenic carbon and land, but the deliverables differ. The ecoinvent mappings below illustrate implementation; neither ISO nor PACT officially designates a software result name.
ISO 14067:2018 — study report
The core rule: calculate the CFP total with the −1/+1 method; record fossil emissions, biogenic emissions and removals, and land use change separately; report product biogenic carbon content separately, but do not include it in the CFP.
| Item | LCIA reference (ecoinvent example) | Treatment |
|---|---|---|
| CFP or partial CFP | kg CO₂e per functional or declared unit | Cradle-to-gate or cradle-to-grave result |
| Impact indicator | Start from IPCC 2021 incl. biogenic CO₂, GWP100 total; −1/+1 for biogenic CO₂ | Check uptake, release, allocation and carbon content are complete; justify any no-LT choice |
| Fossil GHG | IPCC 2021, climate change: fossil, GWP100 | In the CFP; recorded separately as a net figure; includes aircraft GHG |
| Biogenic GHG emissions | incl. biogenic CO₂ no LT, biogenic emissions | In the CFP; recorded separately |
| Biogenic GHG removals | incl. biogenic CO₂ no LT, biogenic removals | In the CFP as a negative; recorded separately |
| Direct land use change | dLUC emissions, net dLUC and dLUC removals, no LT | In the CFP; net emissions and removals recorded separately; 20-year period is common |
| Indirect land use change | — | No internationally agreed procedure yet; record separately if calculated |
| Aircraft GHG | climate change: aircraft emissions, no LT | In the CFP and recorded separately; fuel-combustion GHG only, not high-altitude radiative forcing |
| Product biogenic carbon content | — | Required for cradle-to-gate studies; recorded separately, not included in the CFP |
PACT 3.0 — exchange fields
PACT’s boundary is cradle to gate. Both PCF totals must be calculated and exchanged; the only difference between them is whether product biogenic CO₂ uptake enters the total. Most of the subcategory fields below are already contained in the PCF — they exist for breakdown and reconciliation and must not be added to the total again.
Per the source article’s reading of PACT Methodology 3.0 and Technical Specifications 3.0.3: biogenic carbon and land calculations may be exempted when product biogenic carbon content is below 5% of total product mass, or when the excluded impact is below 3% of the cradle-to-gate PCF. Product biogenic CO₂ uptake is calculated as kg biogenic carbon × 44/12; where no other data exist, PACT allows a default of 0.475 kg biogenic carbon per kg of dry biomass — a default that must not be applied to the wet mass of the product.
| Field | PACT 3.0 requirement | LCIA reference (ecoinvent example) |
|---|---|---|
| pcfExcludingBiogenicUptake / pcfIncludingBiogenicUptake | Both SHALL; exchanged as a pair; the difference should equal biogenicCO2Uptake | IPCC 2021 total (excl. biogenic CO₂) and IPCC 2021 incl. biogenic CO₂ total, GWP100 — verify the difference, since the two methods also adjust biogenic CH₄ factors |
| ipccCharacterizationFactors | SHALL; latest AR, currently AR6 | IPCC 2021 GWP100 |
| fossilGHGEmissions | SHALL; includes land-management fossil and aircraft emissions | climate change: fossil — do not add land-management or aircraft figures again |
| biogenicNonCO2Emissions | BIO; biogenic CH₄ only in PACT 3.0 | biogenic (excl. CO₂) — Methane, non-fossil at 27 |
| landUseChangeGhgEmissions | BIO; replaces dLucGhgEmissions; direct or statistical LUC | dLUC emissions as a starting point — does not replace statistical LUC calculation |
| landManagementFossilGhgEmissions | BIO-2027; a breakdown within fossil emissions | No dedicated ecoinvent category; extract via contribution analysis, do not add back |
| landManagementBiogenicCO2Emissions | BIO-2027; net stock loss within the same land use | Identify flows such as from soil or biomass stock in the LCI; keep separate from LUC |
| landManagementBiogenicCO2Removals | MAY; negative; only with traceability, primary data, no double counting and ongoing monitoring | dLUC removals or to soil or biomass stock are cross-checks only, never sufficient on their own |
| biogenicCO2Uptake | BIO; negative; enters only the including-uptake PCF | Cross-check with incl. biogenic CO₂ biogenic removals; report from product biogenic carbon |
| aircraftGHGEmissions | MAY; engine GHG only; already inside fossil emissions | climate change: aircraft emissions — for breakdown only |
| fossilCarbonContent | SHALL in Tech Specs 3.0.3; kg C, outside the PCF | From composition, measurement or mass balance |
| biogenicCarbonContent | BIO; kg C, outside the PCF; used to verify uptake | Measurement, composition or qualifying default |
| recycledCarbonContent | SHOULD; kg C, outside the PCF | From recycled input quantity, carbon content and chain-of-custody evidence |
| landAreaOccupation | Not in the PCF; Should in Methodology 3.0, MAY in Tech Specs 3.0.3 | Not an IPCC climate result; from land occupation flows |
Field names and obligations should always be checked against the current PACT specification and any customer template, which may rename or tighten them.
8. Verifying the two totals
ecoinvent itself cautions that including-uptake results involve multi-output allocation and may inflate or distort biogenic uptake. Negative values deserve particular care, should not be quoted alone, and should be read alongside the excluding-uptake result. ecoinvent provides a flow, Carbon dioxide, non-fossil, resource correction, to correct physical carbon distortion caused by allocation.
The practical check: convert the product’s non-fossil carbon into CO₂ uptake and compare it with the difference between the two totals. They should broadly reconcile.
9. Practical checklists
Corporate PCF leads
- State the standard, version, declared unit, GWP horizon and biogenic convention in every RFQ and scope of work.
- Require both PCF totals, applicable subcategories, product carbon content, method metadata and a reconciliation table.
- Keep customer field definitions and their versions — never just the number.
LCA practitioners
- Confirm the database version, system model and LCIA method package match before calculating.
- Keep fossil flows, biogenic CO₂ uptake and release, biogenic CH₄, LUC, land management and aircraft emissions separate.
- Check including-uptake results against product biogenic carbon; investigate background allocation when a negative appears.
Reviewers and verifiers
- Spot-check elementary flow names, UUIDs, compartments, directions and CFs.
- Distinguish ISO requirements to include in the CFP, record separately, or provide as supplementary information.
- For land-management removals, check physical traceability, primary data, double-counting controls and permanence evidence.
Supply-chain lead firms
- Align boundary, declared unit, IPCC version, horizon and biogenic convention before comparing supplier PCFs.
- Ask suppliers to explain the difference between the two totals and reconcile it with product biogenic carbon.
- Keep PCF total, product biogenic CO₂ uptake, product biogenic carbon content and land carbon removals distinct.
10. Conclusion: keep a mapping worksheet
The whole argument runs along one chain: elementary flows enter the inventory, LCIA methods assign them factors, and standards and exchange frameworks decide which results are split out and passed on. Each layer can introduce differences that are invisible in the modelling interface and only surface when the method implementation documents and field definitions are opened.
The recommendation is to keep a mapping worksheet for every PCF delivery, recording exchange field, LCIA category, contributing elementary flows, characterisation factors and method version in a single record. Before formal submission, verify database and method versions, elementary flow UUIDs, compartments, flow directions and characterisation factors. OpenLCA, SimaPro and GaBi are carriers of methodology; the imported method package and software settings determine how the result is generated.
The next time a negative including-uptake PCF appears, resist the phrase “carbon-negative product." First establish how much biogenic carbon is physically in the product, whether allocation inflated the uptake, when it will be released, and whether any land removals meet PACT and ISO conditions.
Reviewer’s note
Commenting on the original article, Lao C observes that supply-chain carbon footprinting has long ceased to be only an accounting problem. Accounting reconstructs the physical world in inventory language; that language has become a language of climate evaluation, and is now becoming a language of commercial exchange and data interoperability. His concern is that if the carbon footprint keeps growing more complex without limit, it risks losing its original meaning — it belongs in climate evaluation, not in an endless contest of data formats, methods and standards.
We share that concern. Accounting is an exercise in reconstructing the physical world. It should not become a form-filling competition.
Credits and sources
Adapted with attribution from a professional article by our partner CPCD/SSBTi. Author: Zhou Quan · Editor: Zhong He · Commentary: Lao C.
- ISO 14067:2018, Greenhouse gases — Carbon footprint of products — Requirements and guidelines for quantification.
- WBCSD, PACT Methodology: Methodology for Calculating and Exchanging Cradle-to-Gate Product Carbon Footprints (PCFs), Version 3.0; PACT Technical Specifications 3.0.3.
- Sonderegger, T., Implementation of Life Cycle Impact Assessment Methods in the ecoinvent Database v3.12, 5 November 2025.
- openLCA Manual.
- IPCC, Climate Change 2021: The Physical Science Basis, Working Group I, Chapter 7 and Table 7.SM.7.
This Digest is a methodological explainer. It does not constitute a determination of conformity with any standard and does not replace the verification procedures required under ISO 14067. Field names and obligations should be confirmed against the current PACT specification and the applicable customer template.


發表留言